Cruise control is not the first system anyone thinks about on a heavily modified Supra. On a torque-based standalone, though, it is one of the most revealing. Cruise never touches the throttle directly. It asks the engine for torque and trusts every layer underneath to deliver it, so if the torque model, the throttle-area table or the drive-by-wire loop is wrong, cruise is where it shows.
This is not a list of gains to copy. Gearing, tyre size and mass change every number below. What carries over is the method: take one sample log, and derive from it what each part of the controller is actually doing. Each check comes with the formula to redo it on your own car.
The control path
Emtron is not commanding throttle position from speed error. The chain is:
Speed error → Cruise PID → torque correction
Torque Target Base + correction → Torque Target Final
Torque Target Final → TMF → throttle-area demand → DBW → engine torque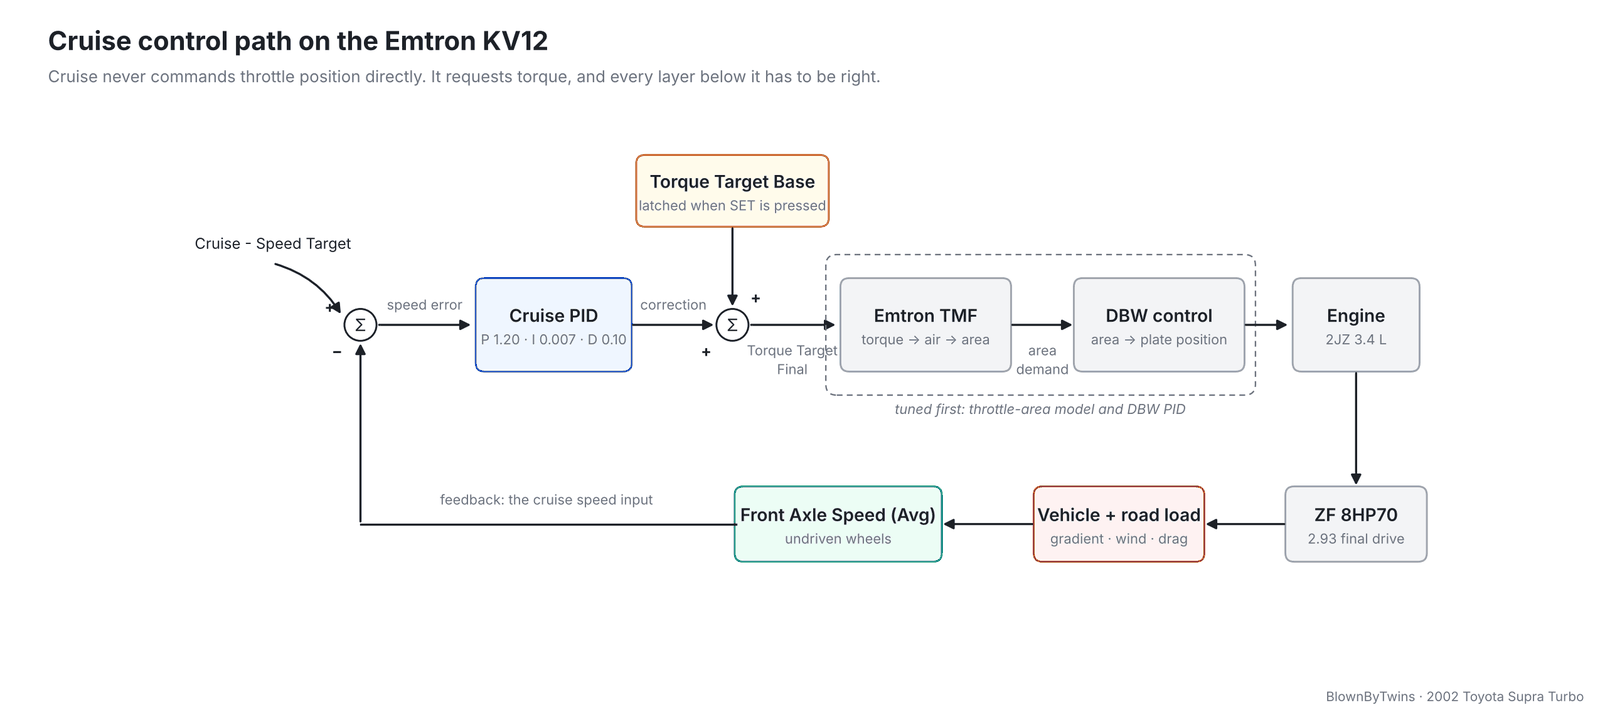
That ordering matters. Cruise PID behaviour is only meaningful once the layers below it are stable, because any error in the throttle-area model or the DBW loop arrives at the cruise controller looking like road load. On this car the throttle-area table and DBW PID were both reworked first.
How Emtron scales the gains
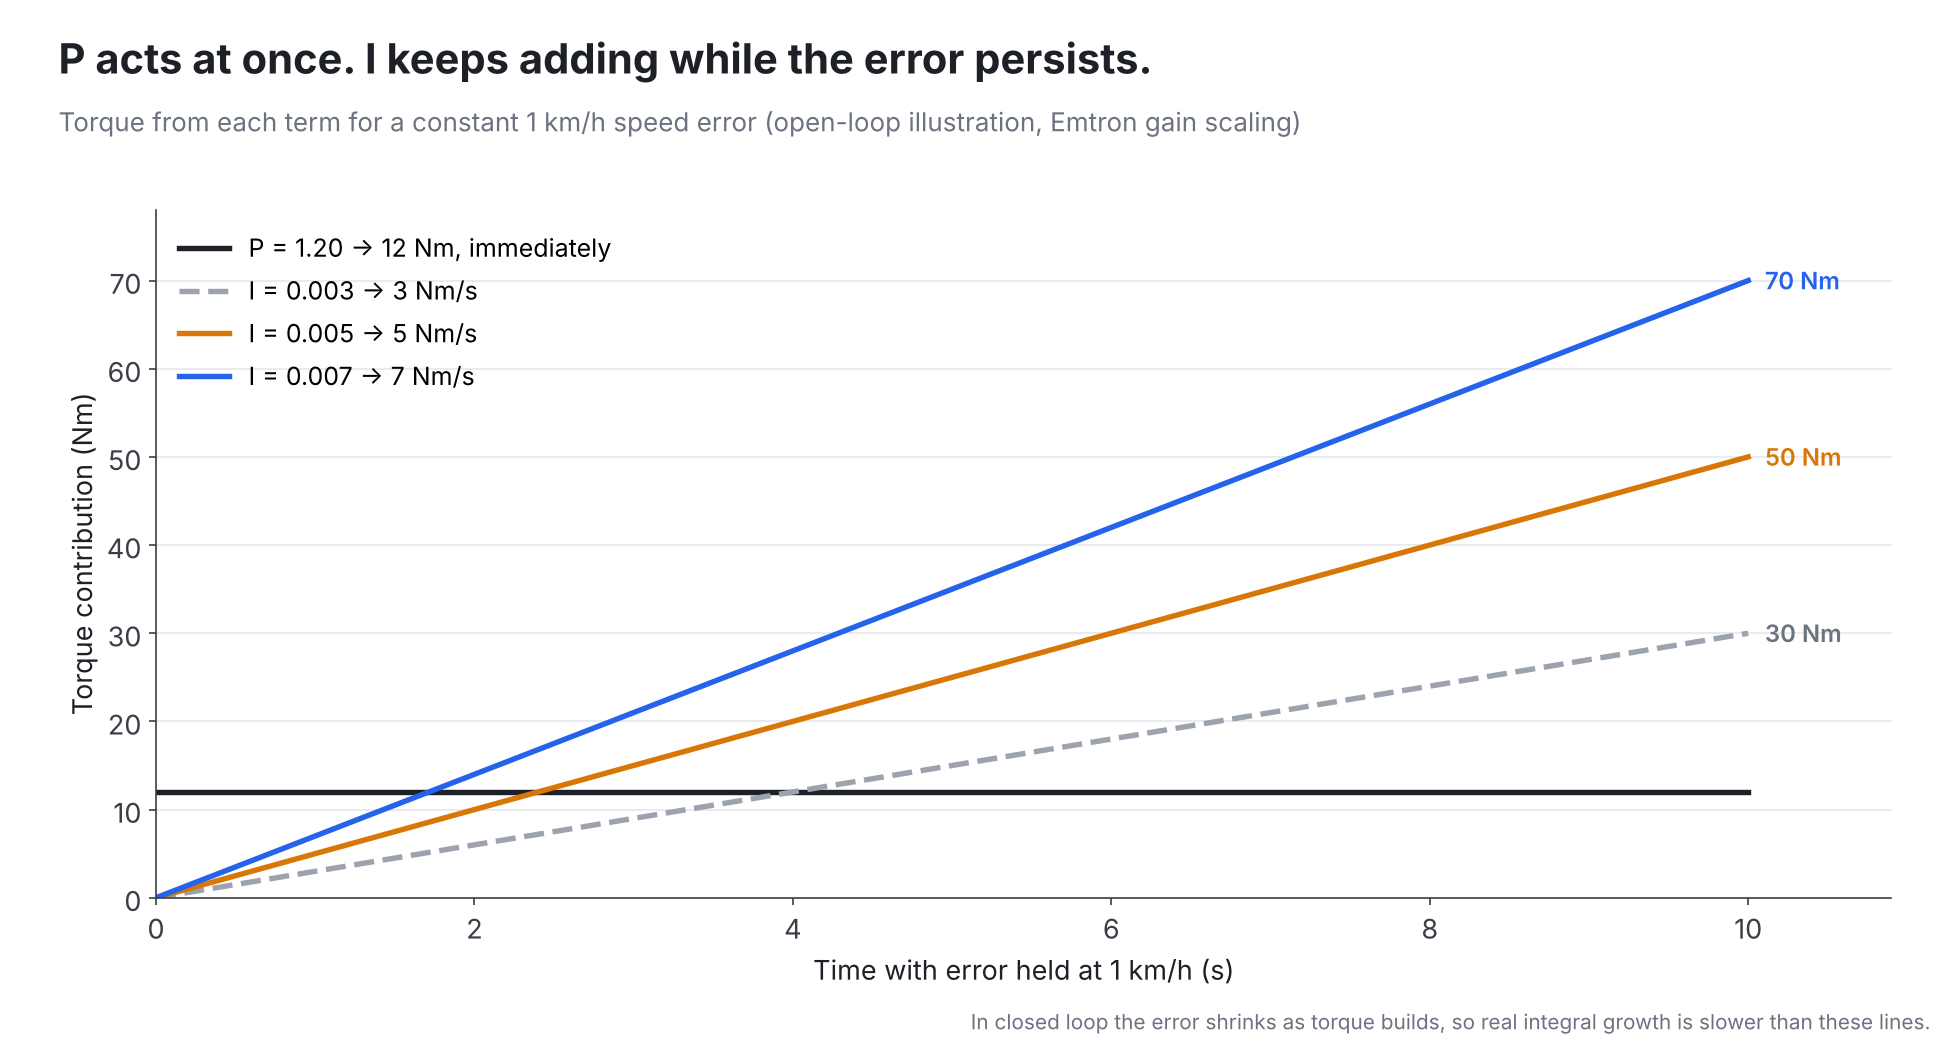
Emtron’s cruise gains map directly to torque:
- P = 1.00 gives ±10 Nm for every 1 km/h of speed error.
- I = 0.010 gives ±10 Nm/s for every 1 km/h of sustained speed error.
So P = 1.20 should give 12 Nm per km/h immediately, and I = 0.003 should add 3 Nm every second per km/h for as long as the error lasts. Those two numbers are what the log gets checked against.
The sample log
The sample is one drive with cruise set three times, all in eighth gear at around 120 km/h, about four minutes of cruise in total. The longest engagement ran for just over three minutes on an ordinary undulating road.
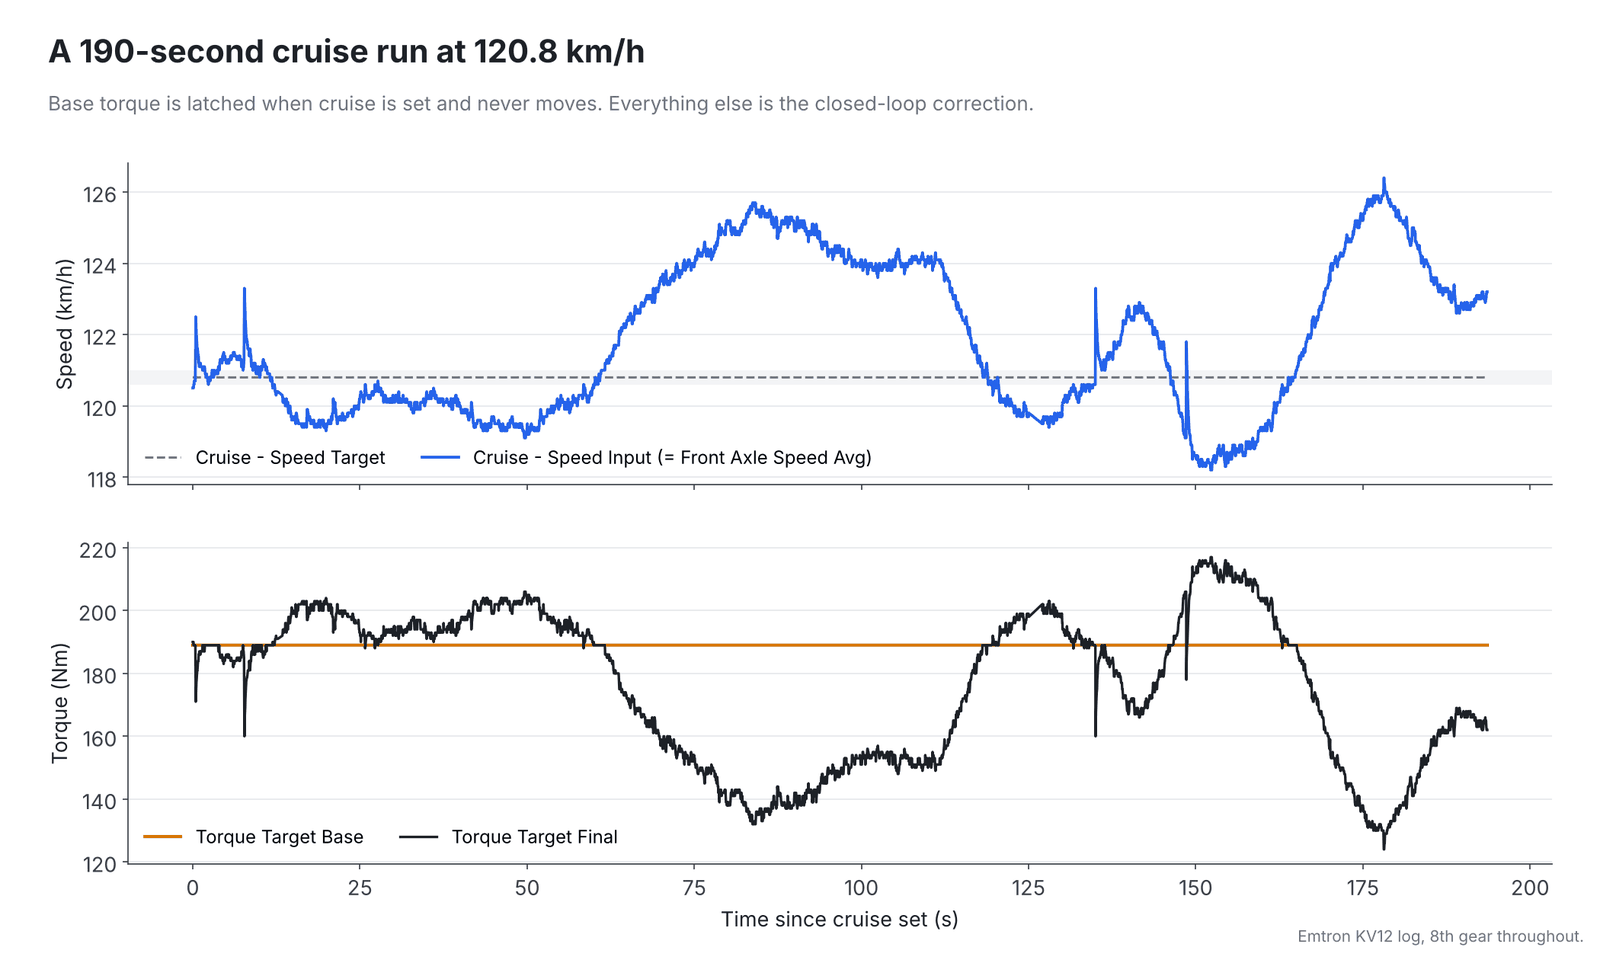
Summary of the three engagements, ignoring the first five seconds after each set:
| Run | Target | Base torque | Max deviation | Mean absolute error | Time within ±1 km/h | Mean error |
|---|---|---|---|---|---|---|
| 1 (194 s) | 120.8 km/h | 189 Nm | 5.6 km/h | 1.9 km/h | 32% | 1.0 km/h over |
| 2 (31 s) | 120.2 km/h | 190 Nm | 4.2 km/h | 1.2 km/h | 49% | 1.0 km/h over |
| 3 (34 s) | 119.3 km/h | 215 Nm | 6.4 km/h | 2.9 km/h | 42% | 2.1 km/h over |
Deviations of up to about ±3 mph, slow rather than fast. The checks below work out why.
What to look for
1. Is cruise using the speed you think it is?
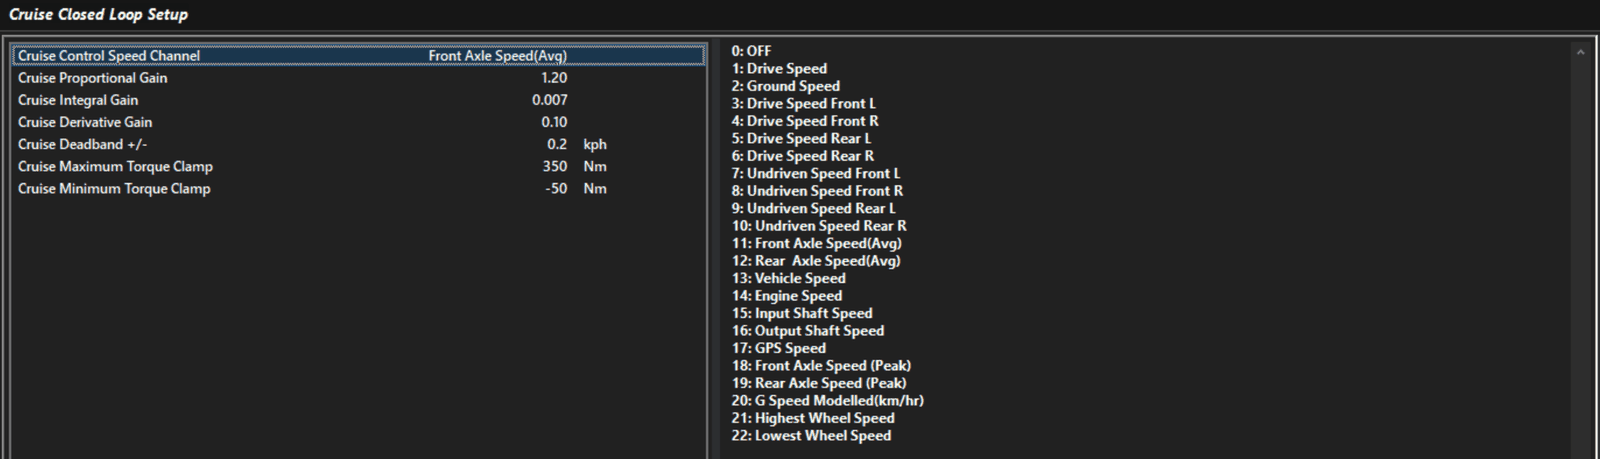
Log Cruise - Speed Input alongside whichever channel you selected as the source. Here the source is Front Axle Speed (Avg), and the two match sample for sample. On a rear-wheel-drive car that is the right source: the front wheels are undriven, so their speed is road speed, not road speed plus whatever slip the rear tyres are carrying.
If the two channels disagree on your car, stop there. Nothing else in the analysis means anything until the controller and the log are looking at the same speed.
2. What is base torque actually doing?
It is tempting to read Cruise - Torque Target Base as a live road-load estimate. In this log it isn’t. It is captured when SET is pressed (189, 190 and 215 Nm on the three runs) and then stays flat for the whole engagement. Every newton-metre of movement in Final is closed-loop correction.
That makes the moment you press SET part of the calibration. Run 3 was set at 215 Nm, more than the car needed to hold 119 km/h, and it spent the whole run about 2 km/h over target with the controller holding a negative correction the entire time. The base is a starting point. Whatever it gets wrong, the closed loop has to carry.
3. Does P match the setting?
Make a derived channel for the correction and plot it against speed error:
Speed Error = Cruise - Speed Target − Cruise - Speed Input
Correction  = Cruise - Torque Target Final − Cruise - Torque Target Base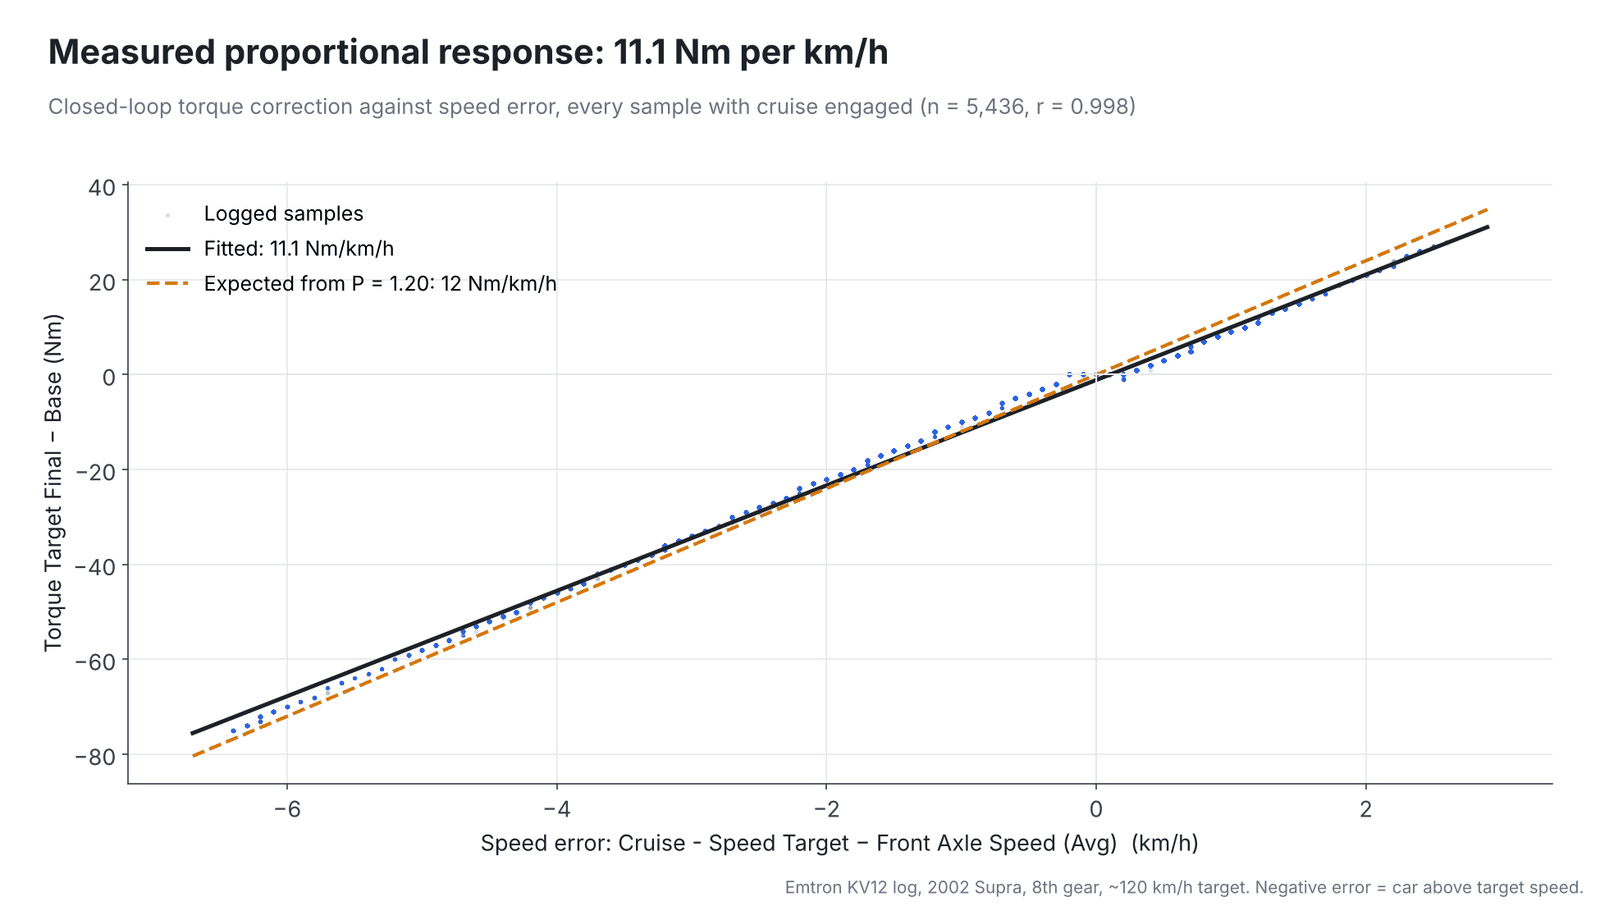
A straight-line fit gives 11.1 Nm per km/h, which looks slightly low against the 12 expected from P = 1.20. Look closely at the middle of the plot, though: the samples step flat across zero. That is the ±0.2 km/h deadband, and Emtron does not just zero the error inside it. It subtracts the deadband from the error everywhere:
P term = 10 × P × (|Speed Error| − deadband) × sign(Speed Error)Fit against that instead and the slope comes out at 12.0 Nm per km/h, with every sample within 1 Nm of the line, which is the resolution of the logged torque channels. P is doing exactly what its setting says.
4. Is the integral doing anything?
This is the check that matters most, and it falls straight out of check 3. Subtract the P term from the correction. Whatever is left is the integral and derivative:
Residual = Correction − P termThen work out what the integral should have contributed. Accumulate the deadbanded speed error over the run and multiply by 1000 × I. For the long run in the sample, the error integrates to about −200 km/h·s. At I = 0.003 that is roughly −600 Nm of integral action, enough to pin the correction against the −50 Nm clamp for the second half of the run.
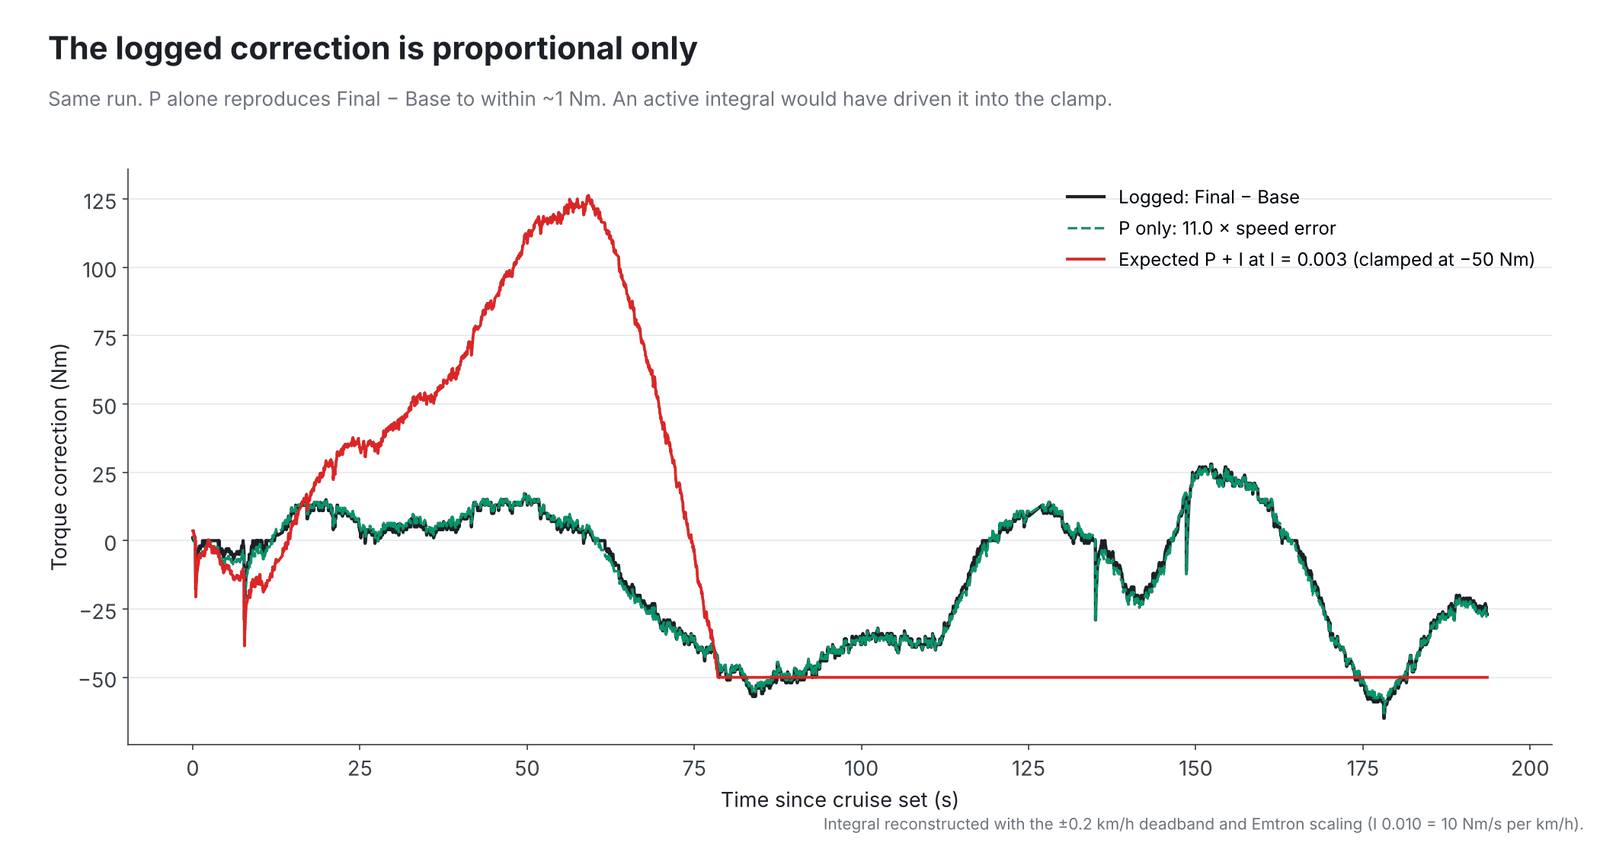
In the sample log the residual is zero to within the 1 Nm logging resolution. The correction is proportional only. You can see the consequence on the road too: between about 85 and 110 seconds into the long run, the car sat 3 to 5 km/h over target while the correction barely moved. A working integrator would have kept pulling torque off for the whole of that period.
When this check comes back empty, adjusting the integral gain is the wrong next move. Find out why the integrator is not contributing first: whether it is gated by a condition, scaled differently from what you expect, or whether the calibration in the car is not the one you think you loaded. If your firmware can log the individual cruise P, I and D outputs, log them.
5. Translate the error into your own car
A proportional-only cruise controller always leaves a steady error when the load changes, because it needs an error to make torque. The size of that error is set by P and by your gearing, which is why nobody else’s numbers transfer.
The extra engine torque a gradient demands:
ΔT_engine = (m × g × sin θ × r_tyre) / (gear ratio × final drive)And the speed error a P-only controller settles at to deliver it:
Δv ≈ ΔT_engine / (10 × P) + deadbandFor the Supra in eighth (about 0.67) with the 2.93 final drive, a 0.33 m tyre and roughly 1650 kg, a 2% gradient needs about 55 Nm more at the engine. At 12 Nm per km/h that is about 4.8 km/h of steady error, almost exactly the ±3 mph drift in the sample log.
Put your own mass, tyre and gearing in and you will get a different number. A car cruising in a lower gear, or on a shorter final drive, sees less engine torque per percent of gradient and a smaller error for the same P.
6. Is D visible?
Not at D = 0.10 in this sample. Once the P term is removed there is nothing left above the logging resolution, so nothing can be attributed to D either. At cruise the rate of change of speed error is small, and so is anything a derivative term makes from it.
Changes since the sample
Integral Gain has since gone from 0.003 to 0.005 and then to 0.007, one step at a time, with P held at 1.20, D at 0.10 and the deadband and clamps unchanged.
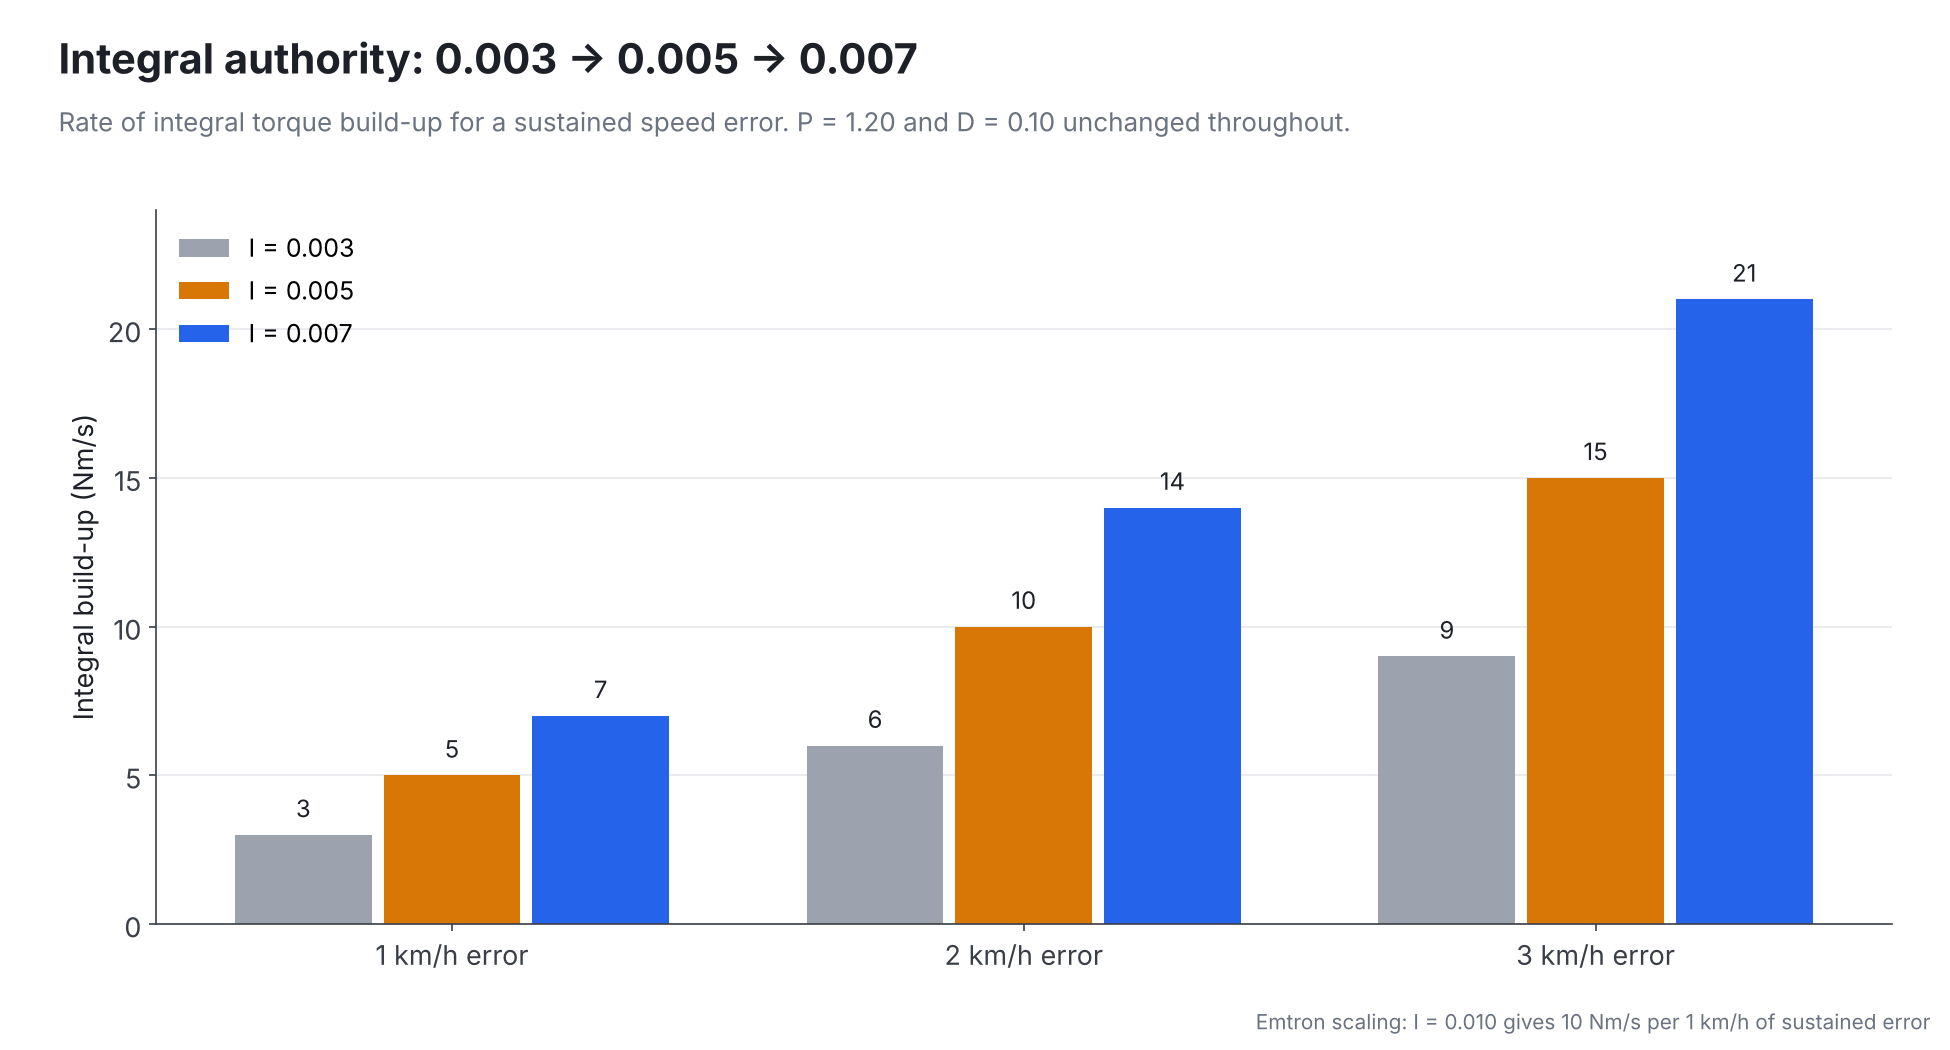
Each step gets judged by check 4 before anything else. A road test on its own cannot separate a better controller from a flatter road. If the residual is still flat at 0.007, the gain was never the problem.
When the integral is working: what to expect
From torque to road speed, a car is close to a pure integrator: net torque sets acceleration, and speed is acceleration accumulated. Wrap a PI controller around that and you get a second-order loop whose damping depends on the ratio of the two gains:
k  = (gear ratio × final drive) / (r_tyre × m) × 3.6     km/h per second, per engine Nm
ζ ≈ (k × 10 × P) / (2 × √(k × 1000 × I))
Raise I with P fixed and the loop recovers faster but with less damping. For the Supra’s numbers, damping falls from about 0.39 at I = 0.003 to 0.26 at I = 0.007, and P would need to be around 1.8 to 1.9 to hold the original damping. Your k is different, so your numbers will be too.
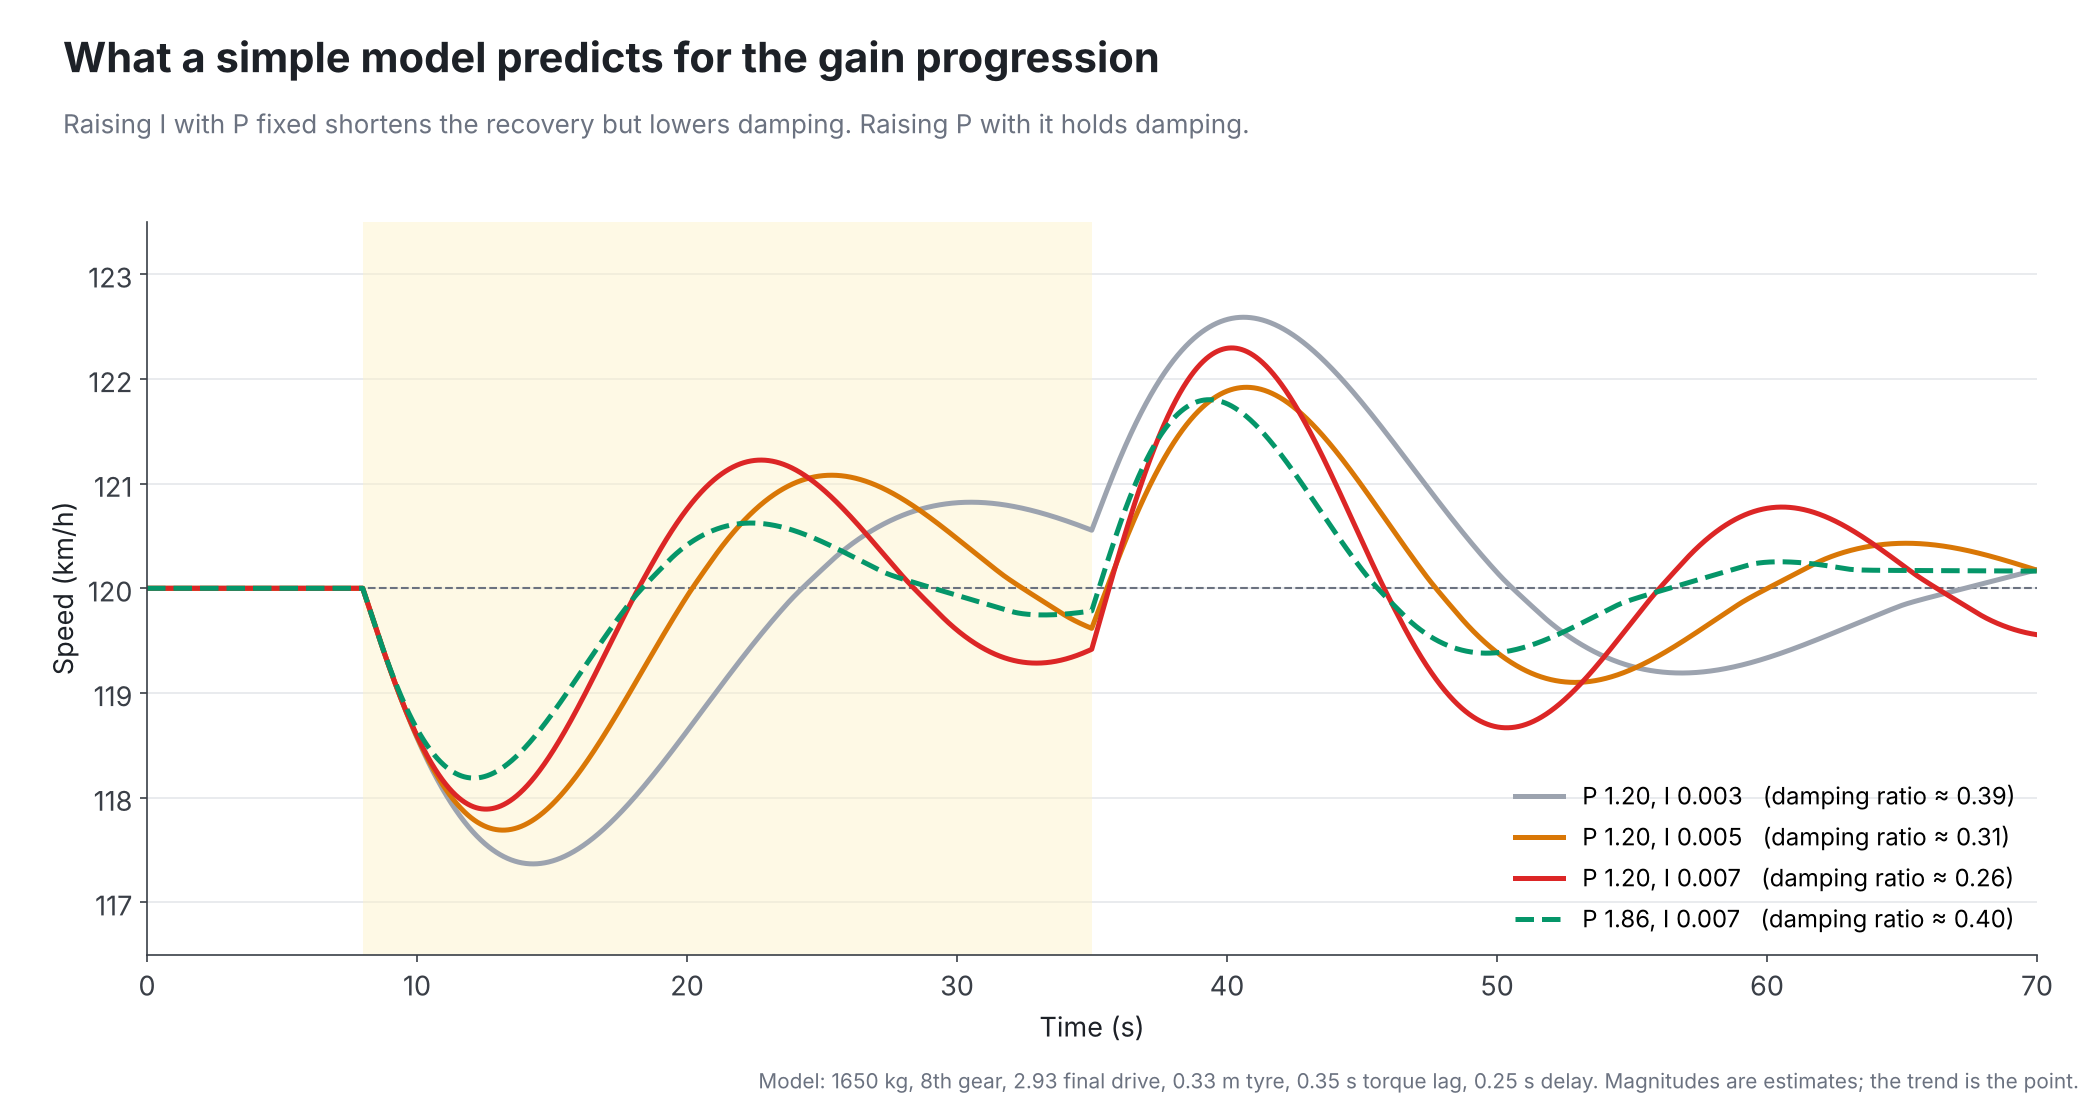
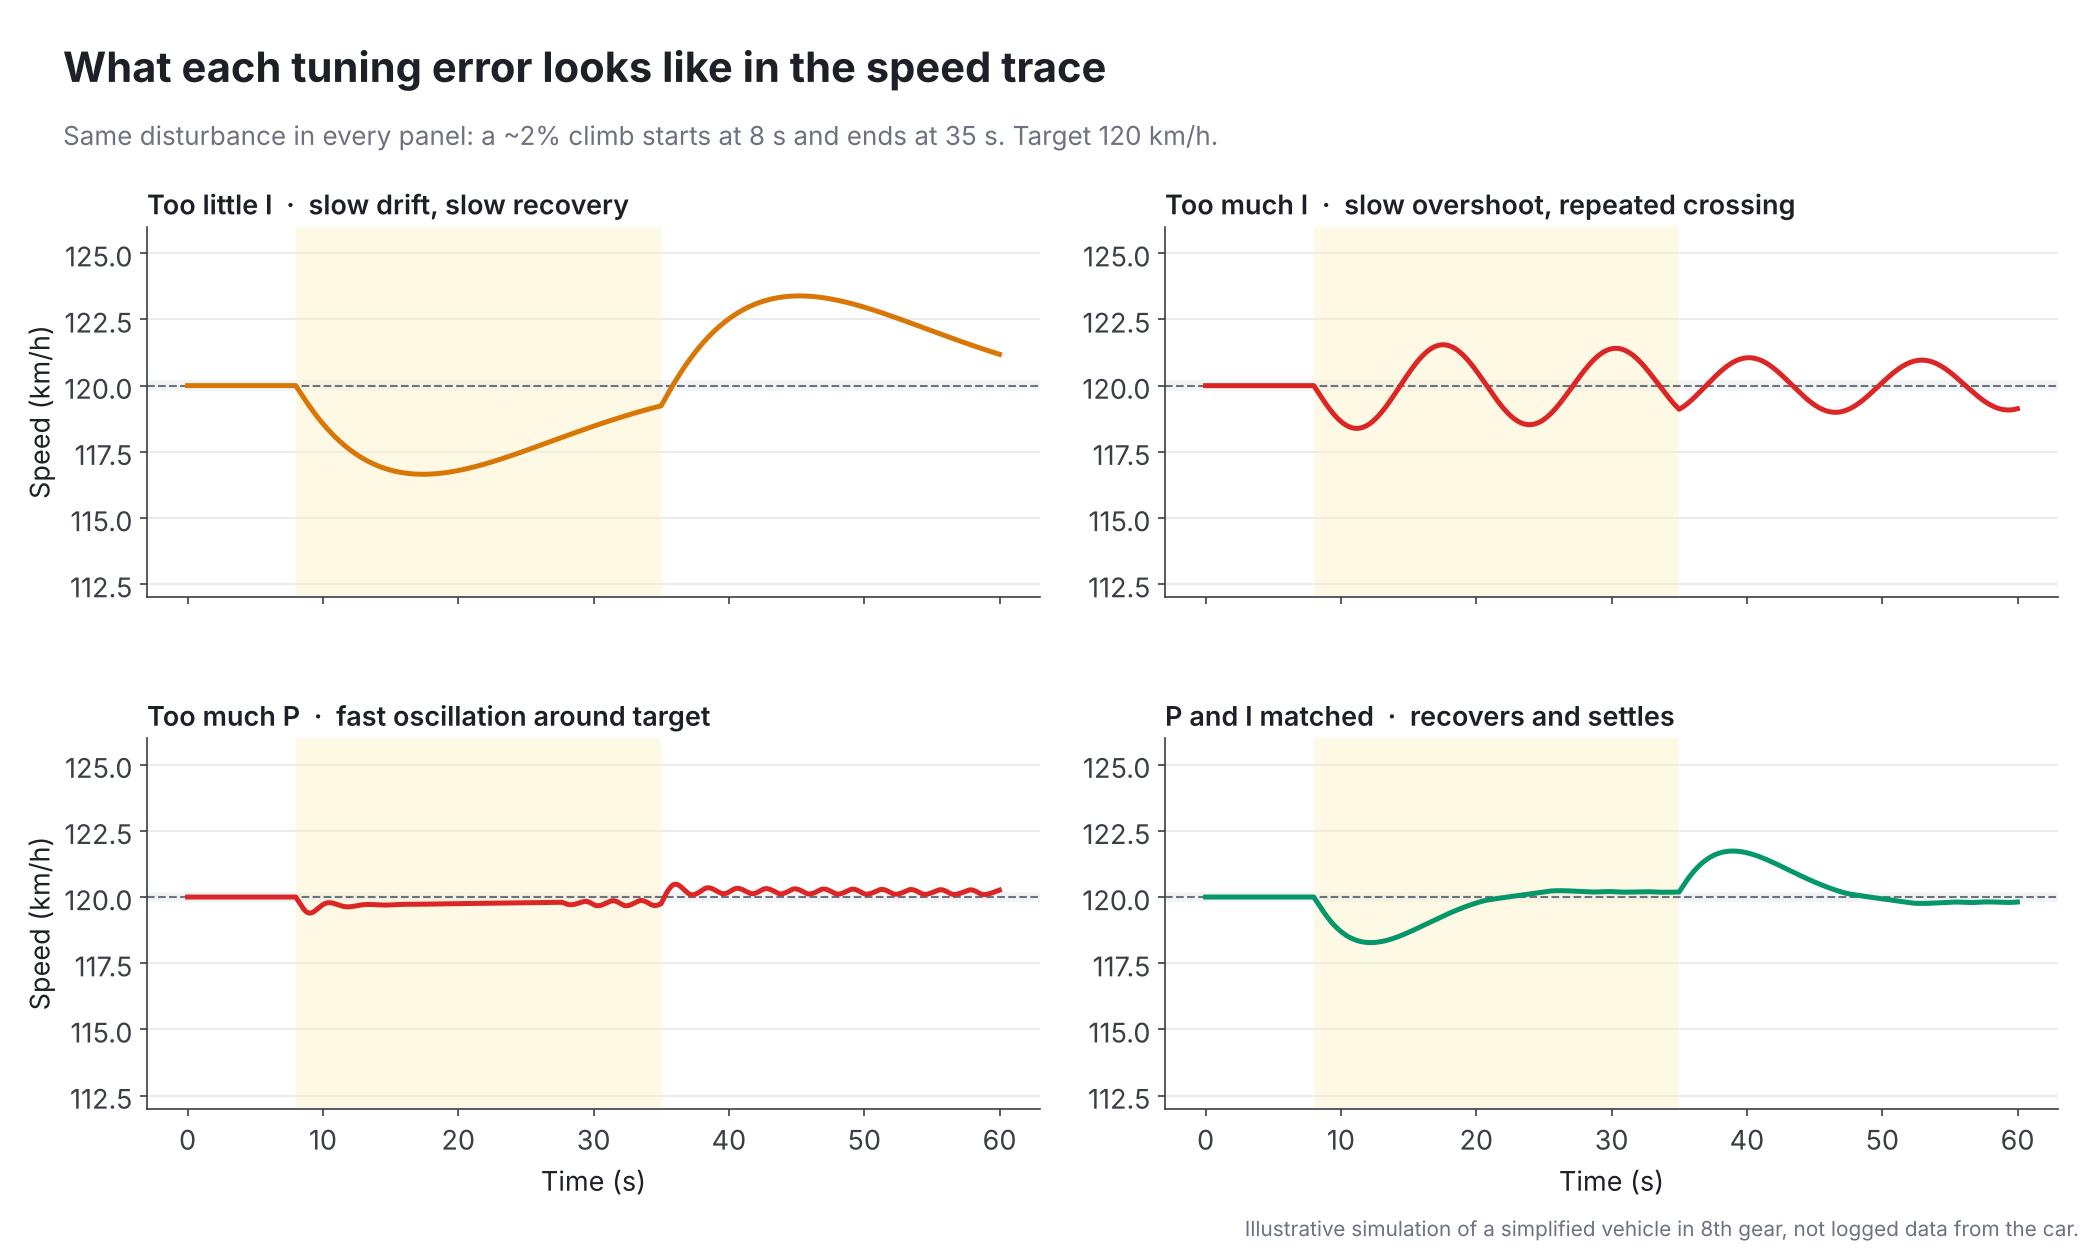
Each tuning error then has its own signature in the speed trace:
- Too little P: weak immediate correction. The car sags at the start of every disturbance.
- Too much P: fast oscillation around target, set by the delay in the torque path.
- Too little or no I: a steady offset that follows the gradient, which is what the sample log shows.
- Too much I: slow overshoot and repeated crossing of target.
- D: works on acceleration, which is small and noisy at cruise. If overshoot appears, P is usually the stronger lever.
Log layout
Everything above comes from four panels and three derived channels.
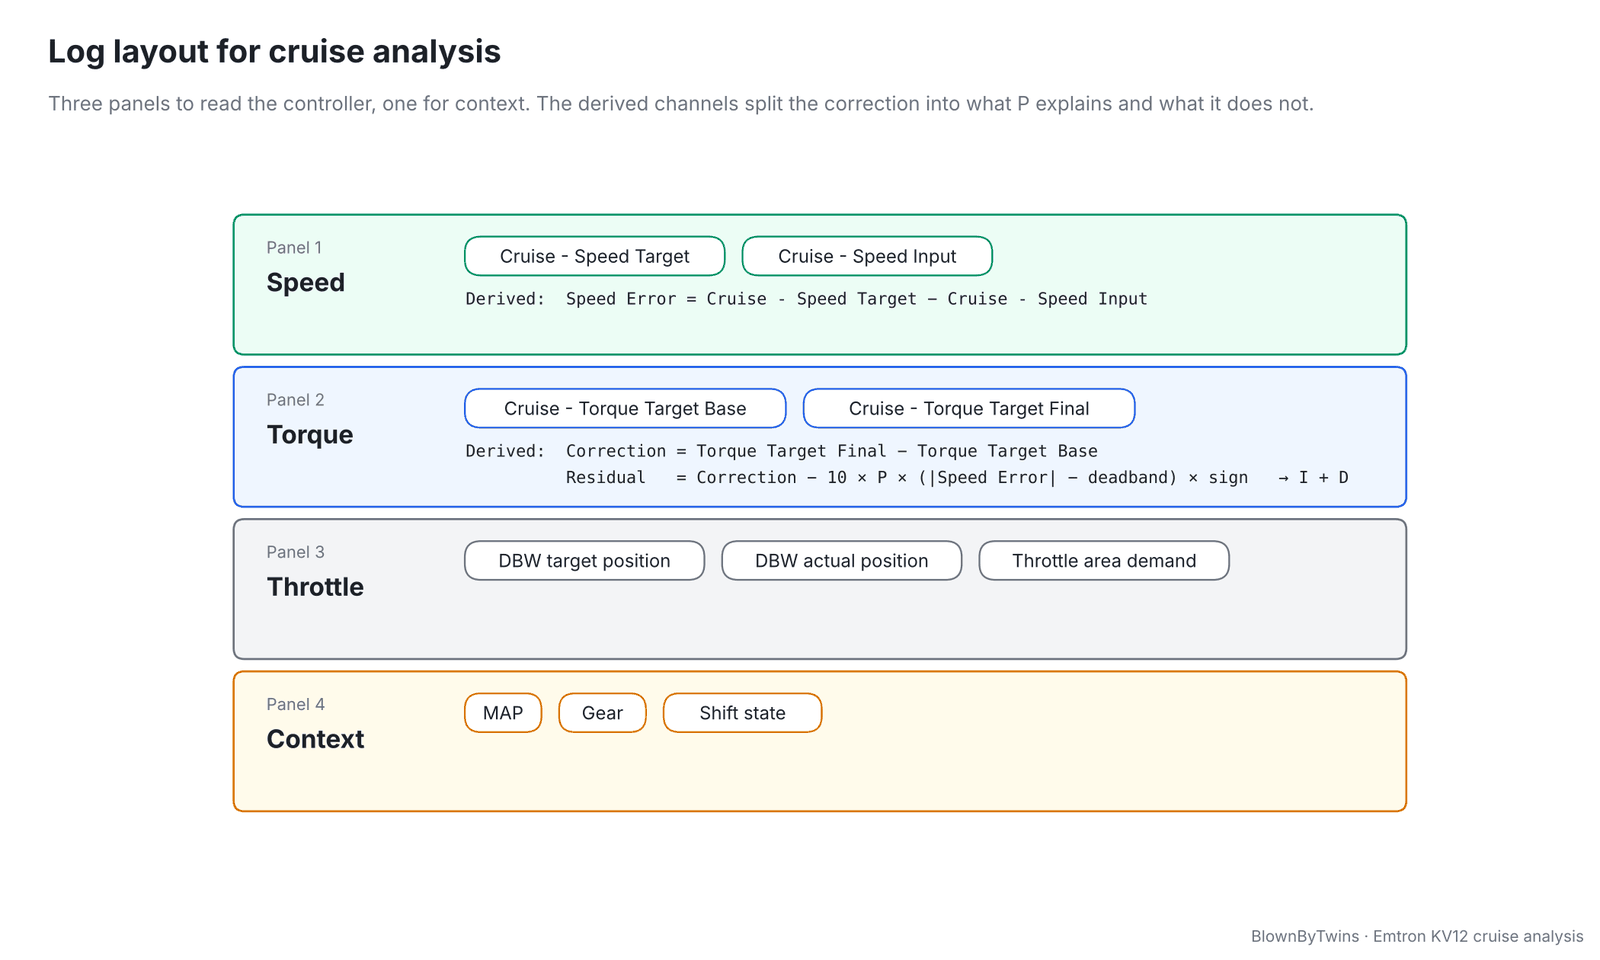
Gear and shift state are there to exclude kickdowns and upshifts. They change the torque-to-speed relationship mid-run and will look like controller misbehaviour if left in.
Current configuration
| Parameter | Value |
|---|---|
| Speed source | Front Axle Speed (Avg) |
| Proportional Gain | 1.20 |
| Integral Gain | 0.007 (sample log at 0.003) |
| Derivative Gain | 0.10 |
| Deadband | ±0.2 km/h |
| Maximum Torque Clamp | +350 Nm |
| Minimum Torque Clamp | −50 Nm |
The broader point
On a torque-managed standalone, cruise depends on the ECU understanding throttle area, airflow, engine torque, DBW response, road speed and transmission state. Get any of those wrong and cruise will find it.
The sample log is a good example of why gains should be derived from the log rather than from how the car feels. The drift looked like a weak integral. The log showed P working exactly as set, a base torque frozen at the moment SET was pressed, and an integral contributing nothing at all. Three different facts, and only one of them is about the integral gain.
Run the same six checks on your own log before you change a number.
Part of the Emtron KV12 series on a 3.4 litre 2JZ. Cruise leans on the same torque model as the traction control strategy and the throttle-area table underneath both. Full specification is on the Supra project page.