1,114 whp, 880 lb ft, and a 295 section road tyre on the back. Traction control on this car is not a driver aid. It is the thing that makes the car usable at all.
Most discussion of traction control stops at “it cuts power when the wheels spin”. That describes about a third of what is actually happening, and it is the least interesting third. The system on this car has a predictive half that tries to never need the reactive half, and the whole design is aimed at keeping the reactive half quiet.
This is how it is set up, and why. Every table is reproduced in full.
Configuration
Status: Verified
- Emtron KV12, torque based traction control
- 3.4 litre 2JZ-GTE VVTi, 1,114 whp on E85, torque limited to 880 lb ft
- ZF 8HP70, 2.93 final drive, OS Giken LSD
- Continental SportContact 7, 265/30/19 front and 295/30/19 rear
- Four individual wheel speeds, three axis internal accelerometer
- Eight position rotary on the steering wheel, over CAN
Everything below is my own work. The base calibration on this car came from SRD Tuning, but the traction control strategy is mine start to finish, which is the only reason I can show you the tables.
The predictive half: torque feedforward
The core of the system is a table that answers one question: at what engine torque does this car lose traction?
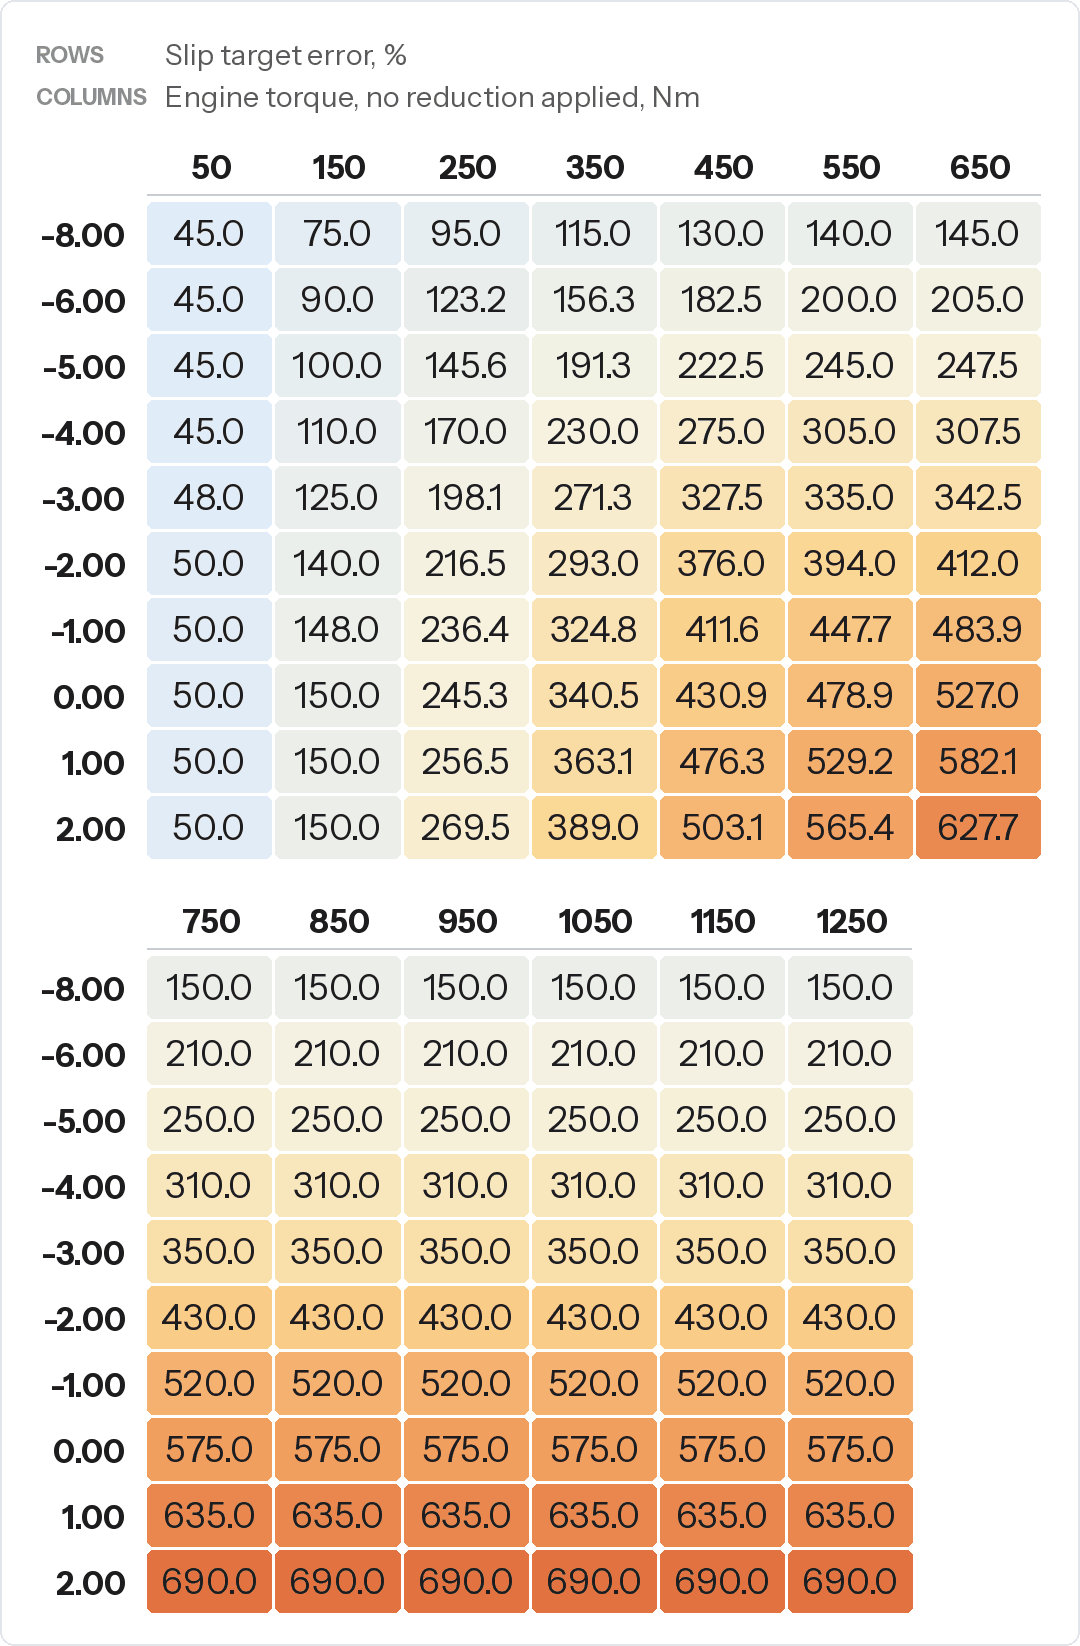
It is indexed on engine torque with no reduction applied, against slip target error. The ECU looks up that number and feeds it forward as the torque target before any measurement of actual slip has influenced anything.
That is the whole idea of feedforward. If the model is right, the engine never makes more torque than the tyres can take, the slip never happens, and the closed loop has nothing to correct.
Look at the first two columns before anything else. At 50 Nm of engine torque the table returns 50, and at 150 it returns 150. Below about 150 Nm it is a pass through: the feedforward is not limiting anything, because at those loads there is nothing to limit.
And this is where the normalisation matters
Read along the zero slip error row and the values climb: 245.3, 340.5, 430.9, 478.9, 527.0, 575.0. And then they stop. Flat at 575 Nm from 750 Nm of engine torque all the way to 1,250.
That plateau is deliberate and it is the single most important thing in the setup.
Extend the slope before the plateau and an unclamped table would be asking for roughly 815 Nm at the top of the range. The engine makes 1,193 Nm. So without the clamp, the feedforward would be handing the PID a target the tyres cannot deliver, and the PID would spend its entire life trying to close a gap that physics will not close.
A saturated PID is not a controller. It is an actuator held wide open. You lose all the proportionality that makes traction control feel like assistance rather than interference.
Clamping the feedforward at something the tyres can actually deliver means the PID always has authority in reserve. That is what “normalised” means here, and it is why the system feels like it is helping rather than fighting.
Normalised against third
The feedforward table is written for third gear. Everything else is scaled off it by two correction tables.
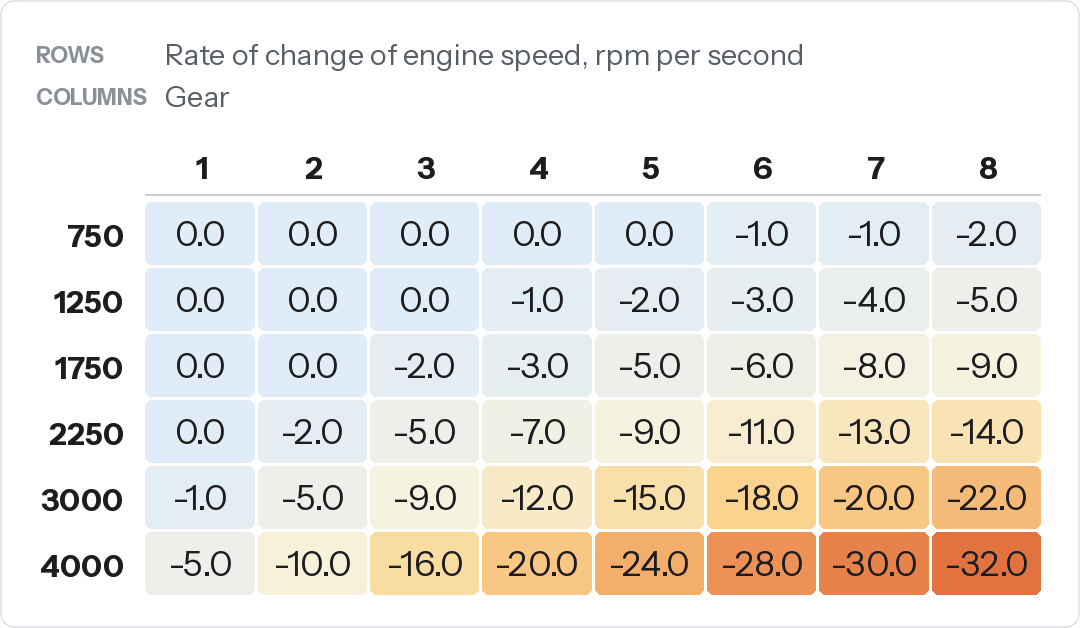
Correction Table 1 is indexed on gear against rate of change of engine speed. In first at low dRPM the correction is zero. By eighth at 4,000 dRPM it is minus 32 percent.
Which makes sense once you think about what dRPM means in each gear. Engine speed rising at 4,000 rpm per second in first is normal acceleration. The same rate in eighth means the driven wheels are going somewhere the car is not. The correction is reading the rate of change as evidence of impending slip, and pulling the target down before the slip calculation has caught up.
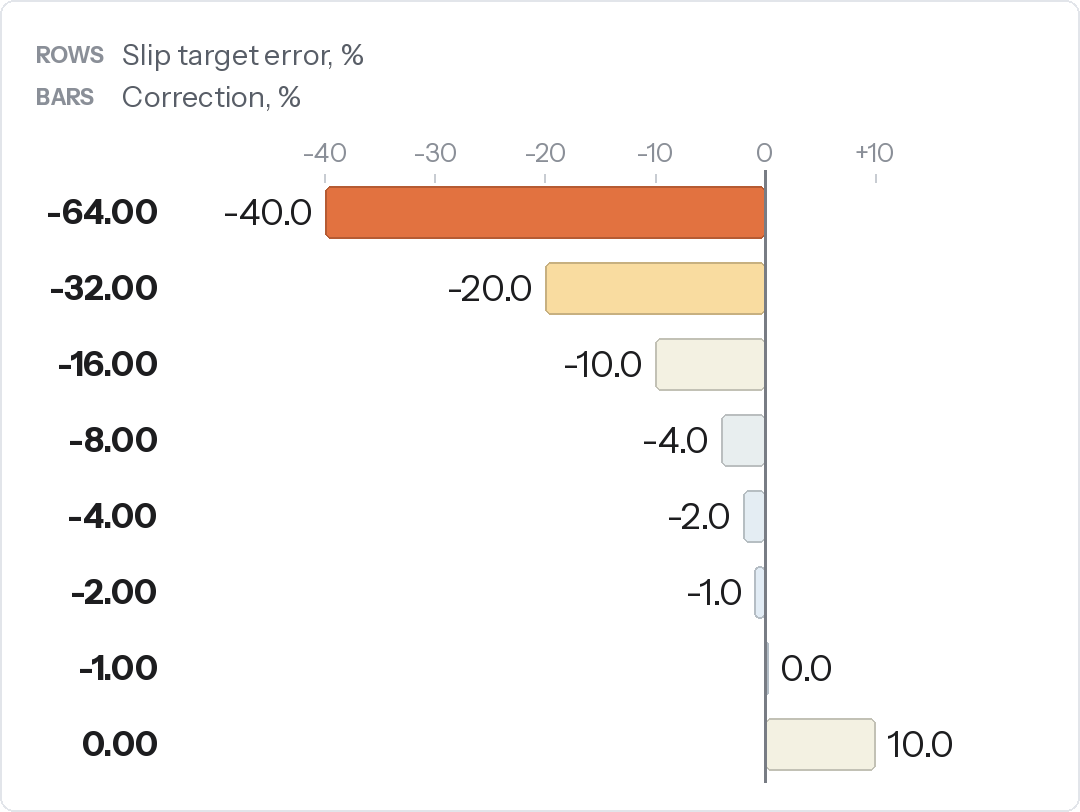
Correction Table 2 does the same job against slip target error directly, from minus 40 percent at large negative error up to plus 10 at zero. That positive 10 at zero error is worth noticing: when the car is exactly on target, the feedforward is allowed to ask for slightly more than the base table says.
The slip target, and what the rotary actually does
Status: Verified
Here is the part I had not seen anyone else do.
The target slip table is indexed on lateral G, from minus 1.5 to plus 1.5, against the rotary position from the steering wheel.
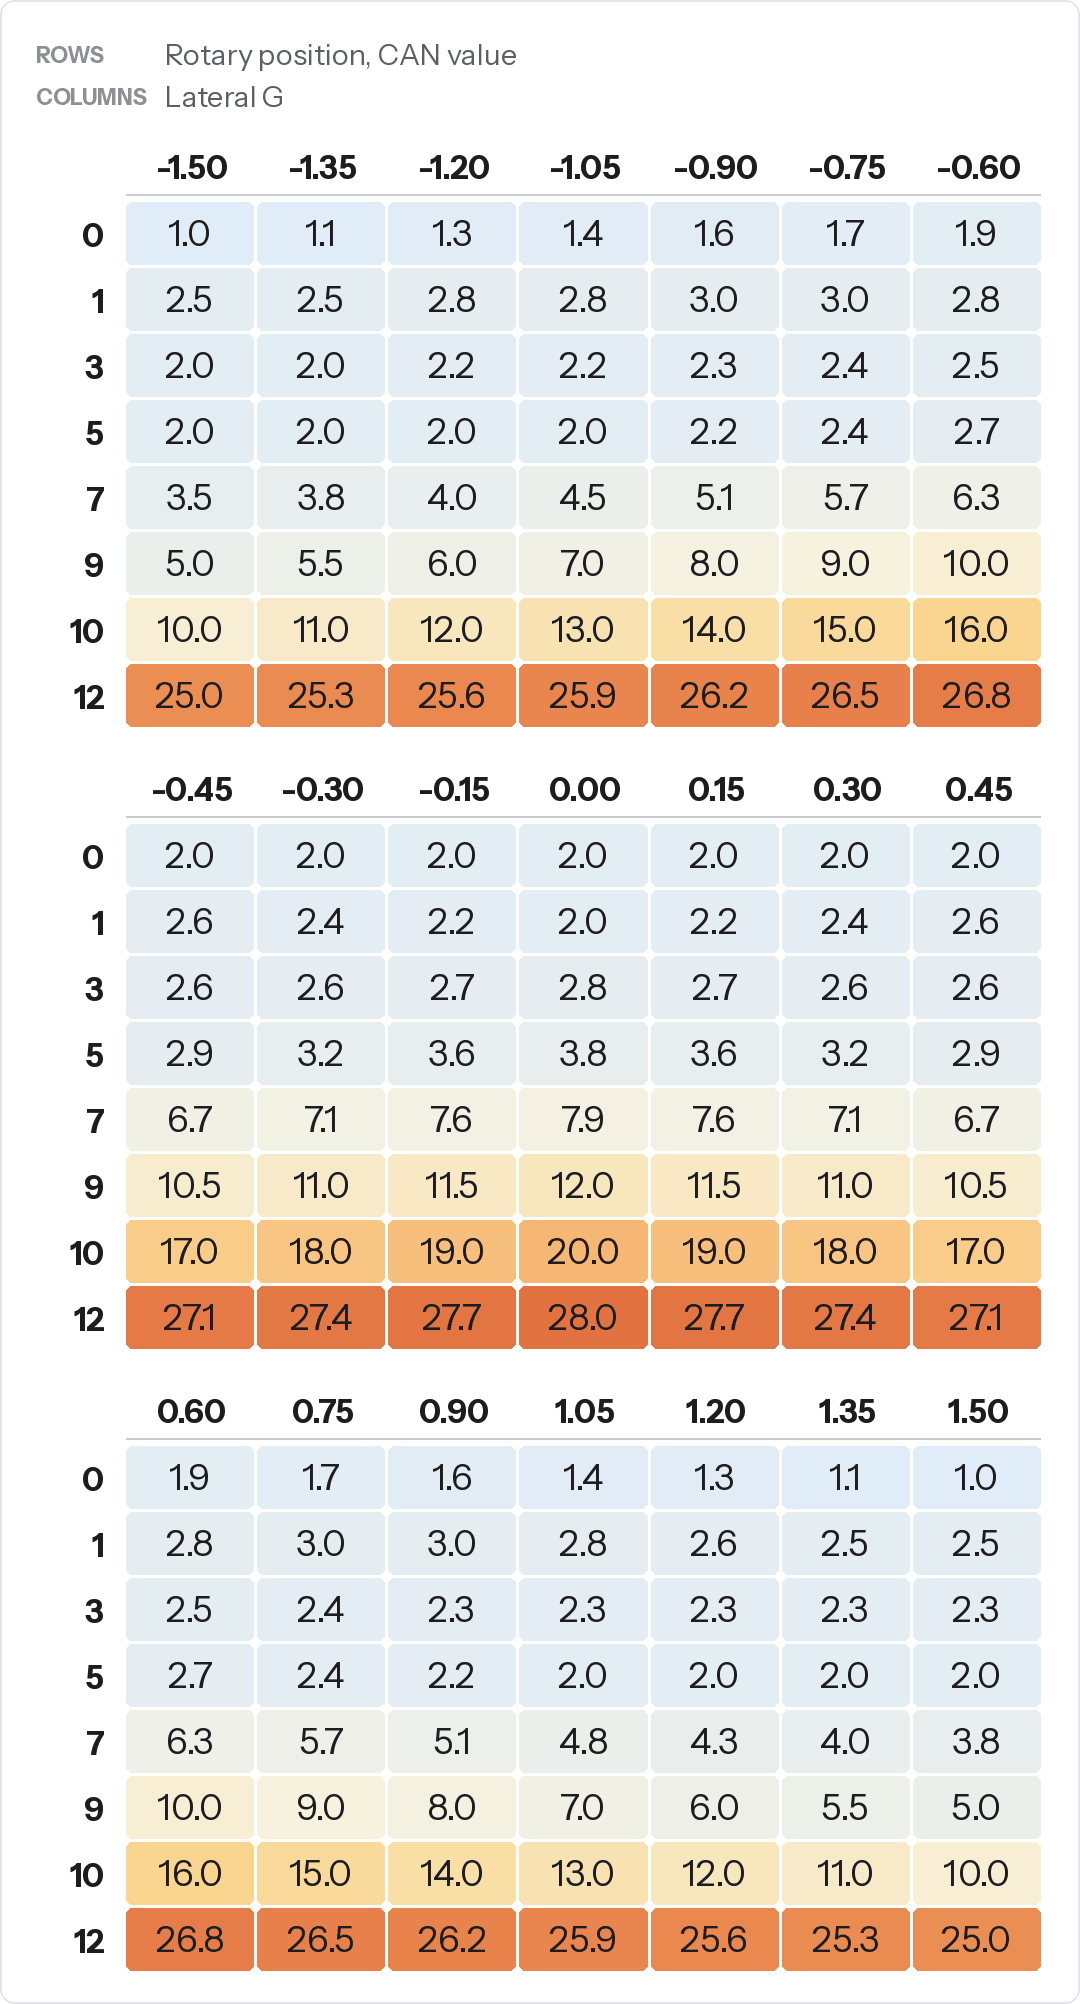
Almost every row is a dome. Maximum permitted slip in a straight line, tapering symmetrically as lateral load builds in either direction. At the loosest setting the car allows 28 percent slip straight ahead, falling to 25 at 1.5 G. At the tightest, 2 percent straight ahead and 1 percent once the car is properly loaded up.
Setting 1 is the exception, and I would rather point at it than pretend it fits. It permits 2 percent straight ahead, rises to 3 percent at around 0.75 G in either direction, and comes back to 2.5 at full lateral load. It is the only row in the table that allows more slip while cornering than it does in a straight line.

So the rotary is not a gain switch and it is not an on/off. It selects how much slip you are allowed as a function of how hard you are cornering, and the system tightens automatically as lateral load increases without the driver doing anything.
And then speed offsets all of it
Lateral G is not the only input to the slip target. A second table offsets it by road speed, and it does a lot of work at both ends.
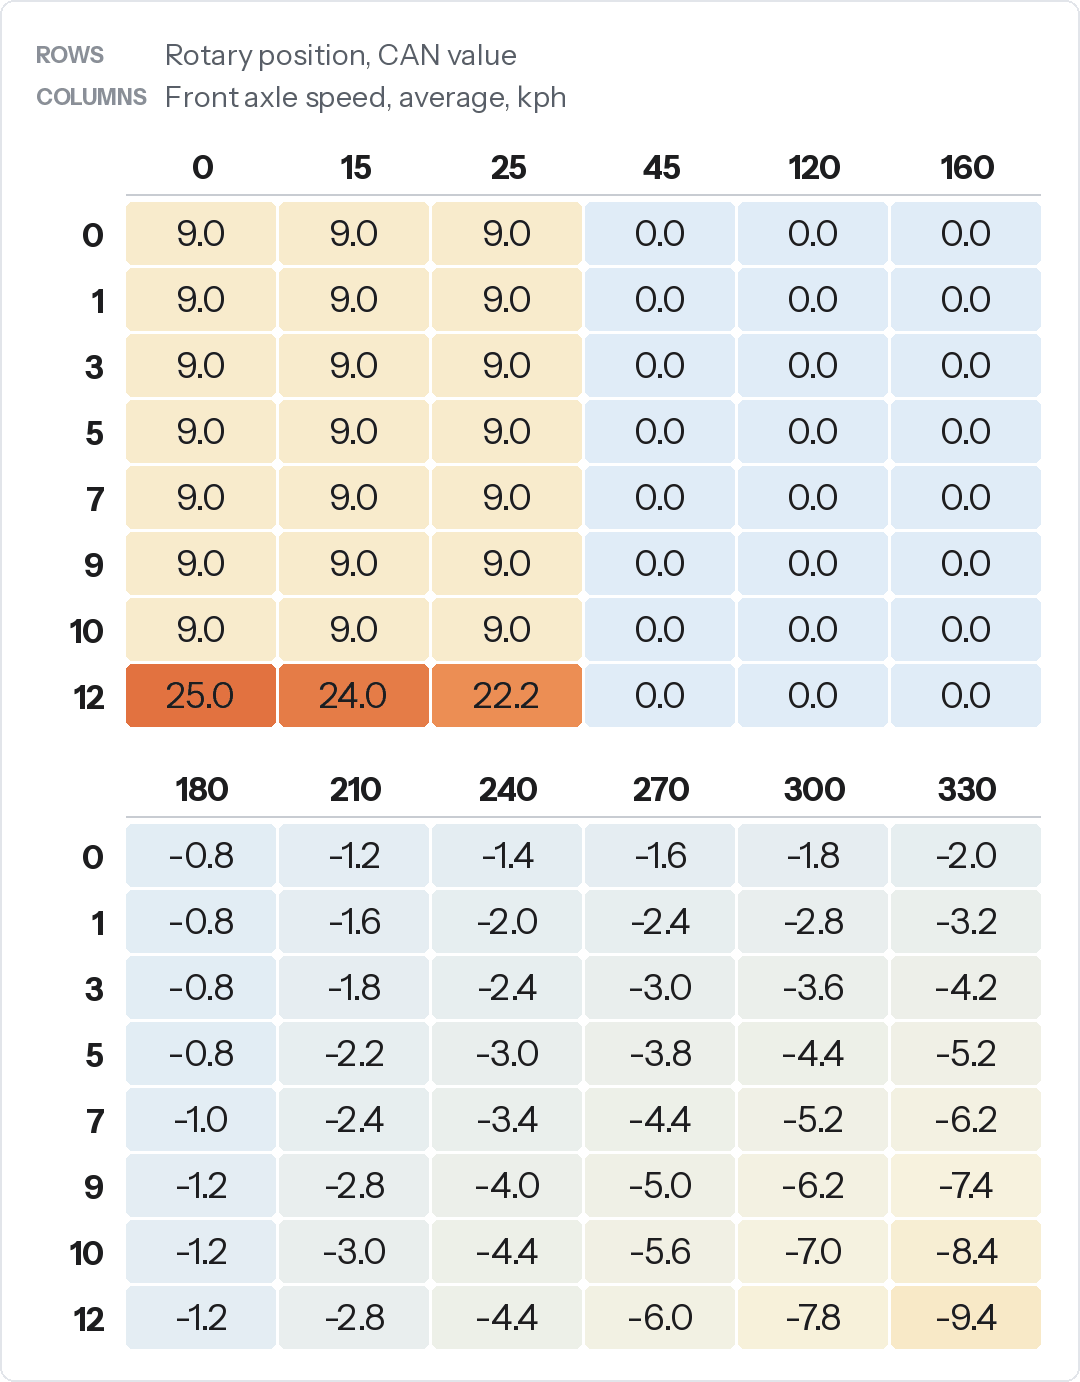
Below 25 kph every setting adds nine percentage points of slip, and the loosest adds twenty five. That is the launch allowance. You cannot get a car like this moving from rest on a target of 2 percent, and without that offset the system would strangle it off the line.
Between 45 and 160 kph the offset is zero and the lateral G table stands on its own. Above 180 it goes negative, and by 330 kph it is pulling back between 2 and 9.4 points depending on the setting.
Which is the right way round. Wheel slip at 40 kph costs you a bit of time. Wheel slip at 300 kph costs you rather more than that.
The reactive half: a deliberately soft PID
Status: Verified
When the feedforward is not enough, the PID takes over. And the gains are the opposite shape to what most people would write. All three share exactly the same breakpoints, so they go in one table.
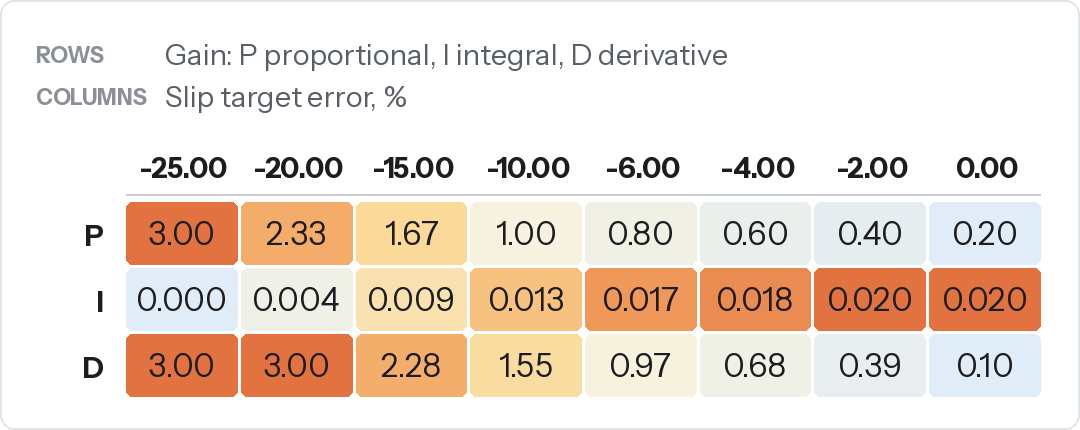
Proportional gain at zero slip error is 0.20. At minus 25 percent error it is 3.00. Derivative runs the same way, 0.10 at zero, and it saturates at 3.00 from minus 20 onwards.
Both are smallest near target and largest far from it.
That is a controller designed to be felt as little as possible. Around the target, where you spend almost all of your time, the loop barely reacts and the feedforward carries the car. Only when things run properly away does it bite hard.
Tune it the conventional way round, with high gain near target for tight regulation, and you get a car that nibbles at the throttle constantly and feels like it is arguing with you.
Integral is almost switched off, on purpose
Look at the integral row against the other two. Peak gain is 0.020, near target. At minus 25 it is zero.
Zeroing the integral term exactly where the error is worst is anti windup by design. When the car is genuinely out of shape, the integrator stops accumulating instead of building up a correction you then have to unwind on the way out. An integrator that has wound up during a slide gives you a second event when it releases, and the second one is usually the one that catches people out.
The rest of the PID setup backs that up:
- Integral control rate: 200 Hz
- Integral positive clamp: 50.0 Nm
- Integral negative clamp: -50.0 Nm
- Minimum torque clamp: 50.0 Nm
- Slip target filter: 4
Fifty Nm either side is a narrow band on an engine making 1,193. The integrator is there to trim, not to intervene.
And the PID does not always run
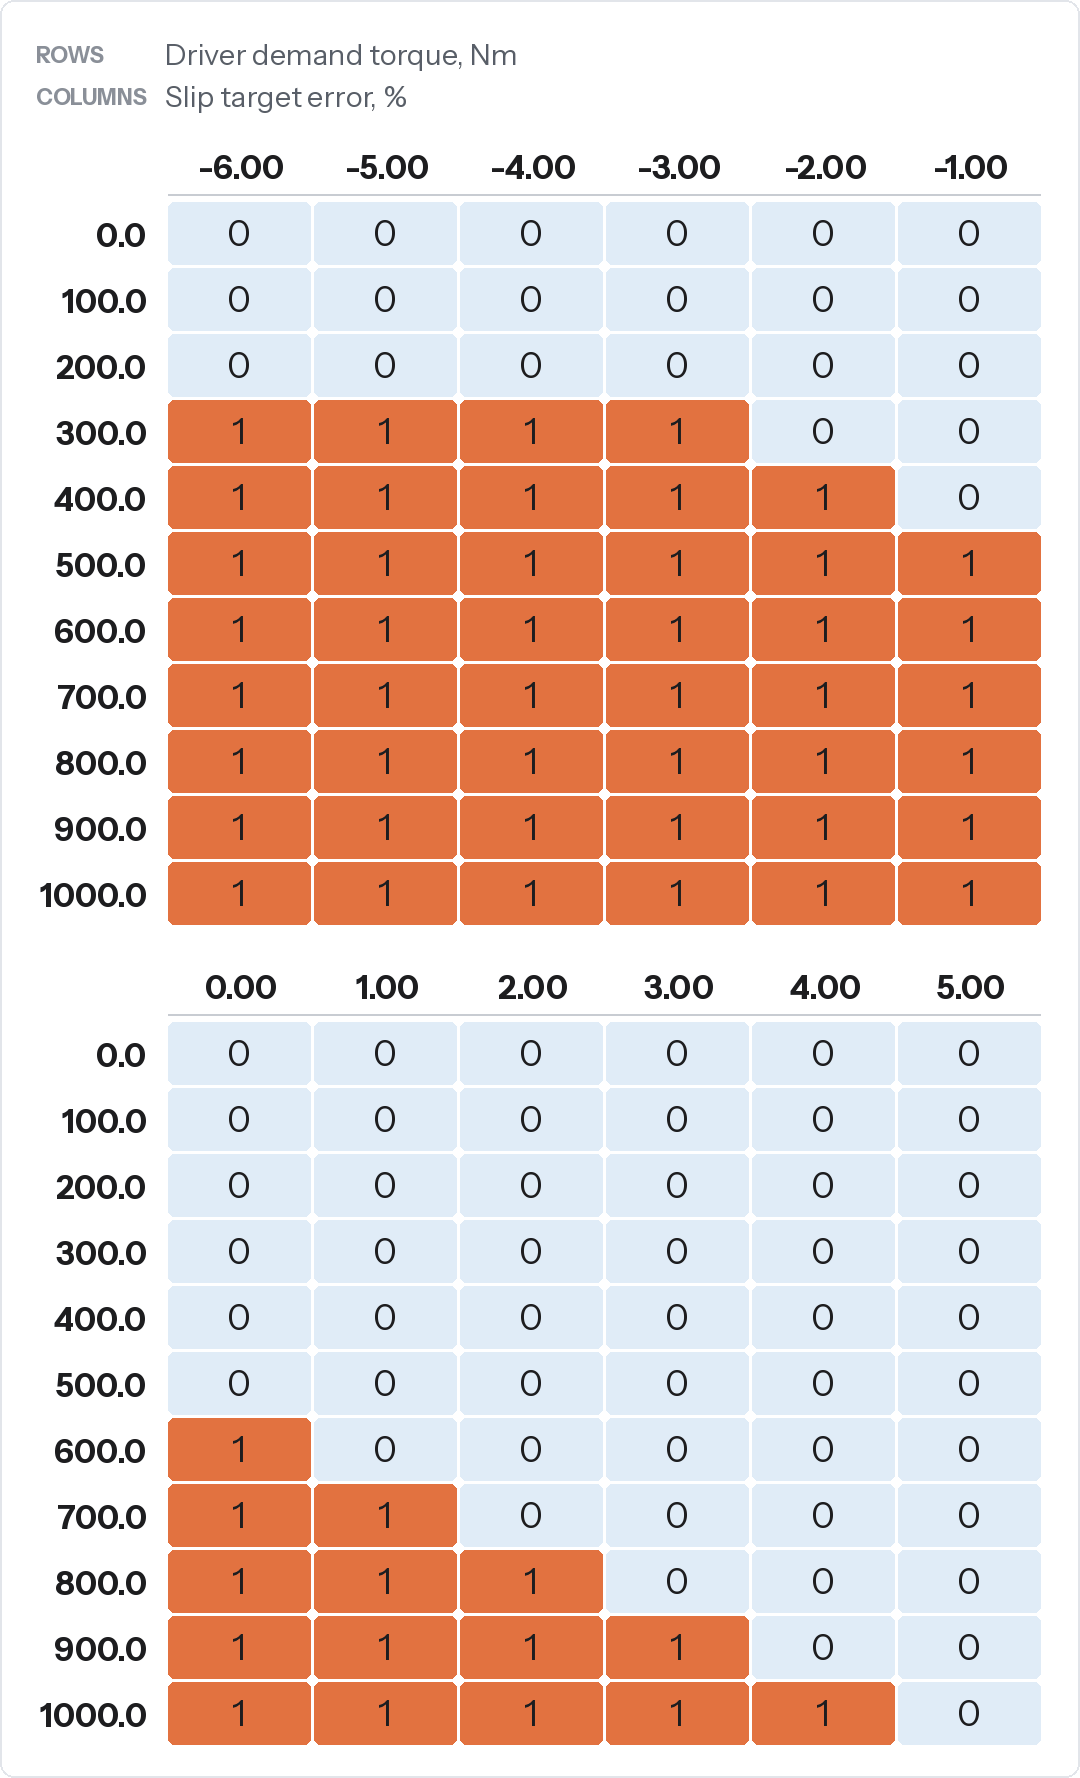
Below 300 Nm of driver demand it is zero across the whole row. The closed loop simply does not run.
Above that it opens up as a staircase. At 300 Nm the loop only runs once slip error is worse than minus 3 percent. Every additional 100 Nm of driver demand brings one more column into play, until at 1,000 Nm it is active everywhere except the far positive corner.
So the amount of authority the closed loop has is itself a function of how much the driver is asking for. At low demand, feedforward handles everything alone, which means the PID cannot introduce noise into normal driving, because at normal driving loads it is not switched on.
What it is allowed to do about it

Emtron gives you three actuators for torque reduction, in a priority order. Mine reads throttle area, then ignition retard clamped at 11 degrees, then OFF.
Cutting is disabled. On a car making 1,114 whp, the harshest tool in the box is not in the box.
The throttle area minimum clamp bottoms out at 10 percent, so it never closes the throttle fully either. Torque reduction happens by moving the plate and pulling timing, and nothing else.
That is a road car decision. Fuel or ignition cutting is fast and effective and it feels like being kicked. On a car that has to be pleasant on a motorway and predictable in the wet, an intervention that arrives as a smooth reduction rather than a hammer blow is worth more than the extra tenth of response.
Does it work?
One number from a road log, second gear, full throttle:
Torque reduction by retard: 8.1 percent.
Eight percent, in retard, on the second priority, with cutting unavailable and throttle intervention having already done its part. That is the system working gently in the conditions where a badly normalised setup would be reaching for everything it had.
It is one data point from one log, so treat it as an illustration rather than proof. But it is the shape of result the whole design is aimed at.
The principle, if you take nothing else
A PID is not there to make your feedforward work. It is there to handle what the feedforward could not have known about: a damp patch, a change in surface, a mid corner bump.
If your feedforward target is unrealistic, the PID spends its authority correcting your model instead of correcting the road. It saturates, it escalates through the actuator list, and the car feels like it is fighting you.
Normalise the target to something the tyres can actually deliver, gate the loop so it only runs when it is needed, keep the gains soft near target, and the reactive half stays quiet almost all the time.
Which is the point. The best traction control is the one you do not notice.
One thing to be clear about
Every number above is specific to this car: this power, these tyres, this gearbox, this weight distribution. The data is not transferable, but the principle is.
I have published the tables in full because seeing how something is structured teaches you far more than reading a description of it. Copy the structure. Do not copy the values.
None of this works without trustworthy wheel speeds, which on a staggered setup is less automatic than it sounds. That is covered in Staggered Tyres and Traction Control. The throttle area table that the whole torque model sits on is covered in Throttle Body Effective Flow Area. Full specification is on the Supra project page.
If you run torque based traction control and have taken a different view on any of this, particularly the gain shape, the setting 1 anomaly or disabling cut, I would like to hear it. This is the part of the calibration I have changed my mind about most.